Image Details
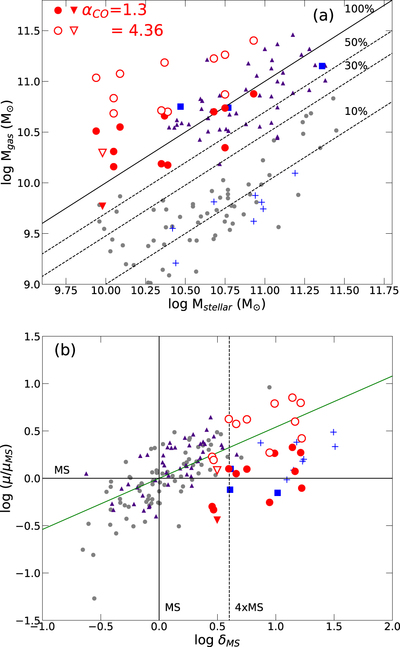
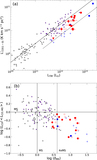
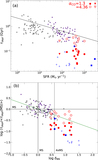
Caption: Figure 7.
Molecular gas mass of high-z starbursts. (a) Log of the molecular gas mass as a function of the log of the stellar mass. Our ALMA starburst sample is shown by filled (open) red symbols, assuming the value of αCO to be 1.3 (4.36) M⊙/(K km s−1 pc2), and an inverted triangle indicates an upper limit on the gas mass. Slanted lines indicate increasing values of Mgas/Mstellar as marked. Additional starburst galaxies from the literature (listed in Section 2.4) with αCO measurements are included at low (blue plus signs) and high (blue squares) redshift. Small gray circles represent low-redshift (z < 0.3) MS star-forming galaxies, while high-z (z > 1) MS galaxies are marked by purple triangles. (b) Molecular gas mass vs. sSFR, with both quantities normalized to the mean value of SF MS galaxies, at the equivalent stellar mass. The parameter on the abscissa, δMS, is the same as in Figure 6(b). The slanted green line is the average relation as reported in Tacconi et al. (2017). The gray circles in the bottom panel represent all SF MS galaxies at z < 1, a less restrictive sample than in the top panel.
Other Images in This Article
Copyright and Terms & Conditions
© 2018. The American Astronomical Society. All rights reserved.