Image Details
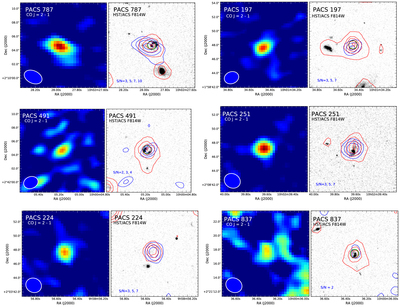
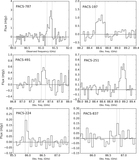
Caption: Figure 4.
CO (2−1) maps of six high-z starbursts observed by ALMA in Cycle 3 (color panels on left). The shape of the ALMA beam is displayed in each panel. The minimum flux level is set at 0.5 × σrms (Table 2). Right panels: grayscale images of each starburst, from the COSMOS HST/ACS F814W mosaics (Koekemoer et al. 2007). CO emission is indicated with blue contours in steps of S/N as shown in each panel. Red contours indicate Spitzer/IRAC 3.6 μm detections that are typically cospatial with the CO emission, indicating a close association between gas, obscured star formation, and the peak of the stellar mass distribution. The green circle in each HST panel marks the position of the FMOS fiber with a diameter of 1.″2.
Other Images in This Article
Copyright and Terms & Conditions
© 2018. The American Astronomical Society. All rights reserved.