Image Details

Caption: Figure 16.
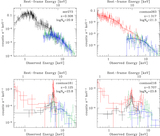
Unbinned source counts for the baseline model case for different ﹩\mathrm{log}{N}_{{\rm{H}}}﹩ bins. For display purposes, we show the counts obtained by including the sources with column density upper limits in the bin relative to their upper limit value. Solid lines show the best-fit power-law models reported in Table 8 and obtained by accounting for the column density uncertainties as described in Section 8. Dotted line is the Euclidean power-law model whose normalization at the lowest flux equals that estimated for the best-fit model. Red long-dashed, blue short-dashed, and magenta dot-dashed lines are predictions from the G07, BA11, and Treister et al. (2009) models, respectively.
Other Images in This Article

Show More
Copyright and Terms & Conditions
© 2018. The American Astronomical Society. All rights reserved.