Image Details
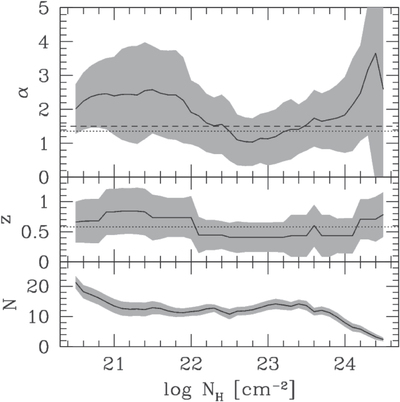
Caption: Figure 15.
Upper panel: best-fit power-law slopes to the log N–log S produced in 0.1 dex ﹩\mathrm{log}{N}_{{\rm{H}}}﹩ steps within 1 dex ﹩\mathrm{log}{N}_{{\rm{H}}}﹩ bins. The slope and the relative uncertainty (shaded gray region) are the median value of the distribution of the best-fit α from 1000 realizations of the sample obtained by randomizing ﹩\mathrm{log}{N}_{{\rm{H}}}﹩ according to their errors and upper limits. Dotted and dashed lines are the best-fit value for the log N–log S of the whole sample and the Euclidean value, respectively. Middle panel: the median redshift and relative interquartile range (shaded gray region) values obtained from the 1000 random realizations of the sample. Dotted line represents the median redshift value. Lower panel: mean value of the number of the sources considered with relative dispersion (shaded gray region) obtained from the random realizations.
Other Images in This Article

Show More
Copyright and Terms & Conditions
© 2018. The American Astronomical Society. All rights reserved.