Image Details
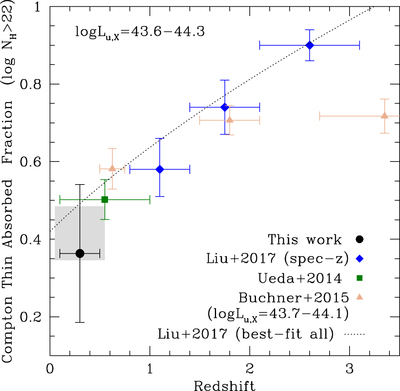
Caption: Figure 14.
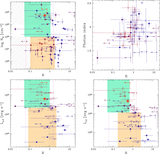
Compton-thin absorbed fractions as a function of redshift for ﹩\mathrm{log}({L}_{{\rm{u}},{\rm{X}}}/\mathrm{erg}\,{{\rm{s}}}^{-1})\approx 43.6\mbox{--}44.3﹩ (corresponding to the 2–10 keV ﹩\mathrm{log}({L}_{2-10}\,/\mathrm{erg}\,{{\rm{s}}}^{-1})\approx 43.5\mbox{--}44.2﹩, assuming an unabsorbed power law with ﹩{\rm{\Gamma }}=1.8﹩ for the conversion). Black indicates the absorbed fraction estimated from our sample. Blue, green, and orange are absorbed fractions obtained by the spectroscopic sample in Liu et al. (2017), U14, and Buchner et al. (2015), respectively (the latter reported at ﹩\mathrm{log}({L}_{{\rm{u}},{\rm{X}}}/\mathrm{erg}\,{{\rm{s}}}^{-1})\approx \mathrm{43.744.1}﹩). The gray shaded region is relative to our data point and gives an indication of the robustness of the estimated absorbed fraction (see Section 7.2 for details). Dotted line is the best-fit model reported by Liu et al. (2017), also including sources with photometric redshift estimates in the absorbed fractions.
Other Images in This Article

Show More
Copyright and Terms & Conditions
© 2018. The American Astronomical Society. All rights reserved.