Image Details
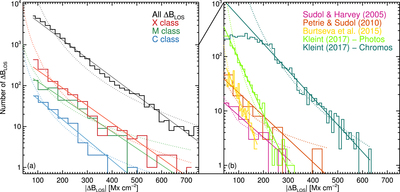
Caption: Figure 9.
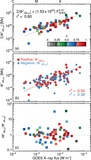
Left: histograms of the frequency distribution of the sizes of ﹩{\rm{\Delta }}{B}_{\mathrm{LOS}}﹩ during three example flares: C7.7—SOL2011-08-08T22:09 (blue), M4.2—SOL2011-03-14T19:52 (green), X4.9—SOL2014-02-25T00:49 (red), and the whole sample of ﹩{\rm{\Delta }}{B}_{\mathrm{LOS}}﹩ (black). Right: the reconstructed histograms of the ﹩{\rm{\Delta }}{B}_{\mathrm{LOS}}﹩ frequency distribution from Sudol & Harvey (2005) (purple), Petrie & Sudol (2010) (orange), the X8.3 flare studied by Burtseva et al. (2015) (yellow), and Kleint (2017) (light green: photospheric ﹩{\rm{\Delta }}{B}_{\mathrm{LOS}}﹩; dark green: chromospheric ﹩{\rm{\Delta }}{B}_{\mathrm{LOS}}﹩). We binned Petrie & Sudol (2010)'s data to 40 Mx cm−2 as in Sudol & Harvey (2005). The distributions of the events of Burtseva et al. (2015) were not rebinned, due to their low dynamic range. The binning for the left panel and for Kleint (2017) is arbitrary for display purposes. The solid and dotted lines show the best fit of an exponential and power-law models, respectively. The sizes of ﹩{\rm{\Delta }}{B}_{\mathrm{LOS}}﹩ from this study, as well as from previous studies, follow a decreasing exponential distribution.
Other Images in This Article
Copyright and Terms & Conditions
© 2018. The American Astronomical Society. All rights reserved.