Image Details
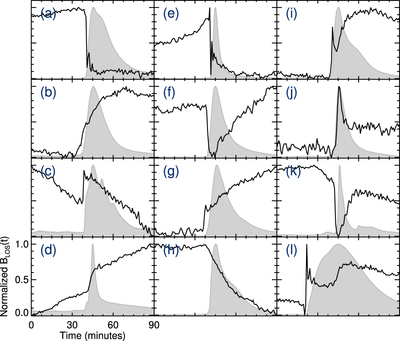
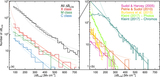
Caption: Figure 3.
Twelve types of temporal evolutions of ﹩{B}_{\mathrm{LOS}}(t)﹩ classified manually by their morphology. The x-axis ranges from 0 to 90 minutes centered on the maximum of the flare. The y-axis shows the normalized ﹩{B}_{\mathrm{LOS}}(t)﹩, and gray shades are the normalized GOES 1–8 Å curves for the flares. Note. Seven of the present types of changes were previously reported in (a) [2–6, 8–10, 13–15], (b) [1–5, 7, 8, 11–20], (c) [2, 12, 15], (e) [7], (i) [15], (j) [4, 21, 22], and (k) [2–4, 6, 7, 9, 21]. References: (1) Wang (1992), Wang et al. (1994), (2) Sudol & Harvey (2005), (3) Petrie & Sudol (2010), (4) Chen et al. (2007), (5) Cliver et al. (2012), (6) Johnstone et al. (2012), (7) Kosovichev & Zharkova (2001), (8) Petrie (2012), (9) Liu et al. (2005), (10) Liu et al. (2014), (11) Petrie (2013), (12) Yurchyshyn et al. (2004), (13) Wang et al. (2012a), (14) Wang & Liu (2010), (15) Meunier & Kosovichev (2003), (16) Deng et al. (2005), (17) Wang et al. (2002a), (18) Wang et al. (2002b), (19) Wang et al. (2012a), (20) Wang & Liu (2010), (21) Burtseva et al. (2015), (22) Gosain (2012).
Other Images in This Article
Copyright and Terms & Conditions
© 2018. The American Astronomical Society. All rights reserved.