Image Details
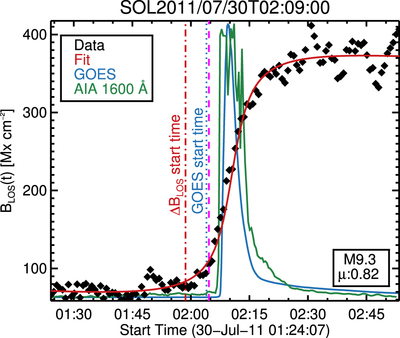
Caption: Figure 8.
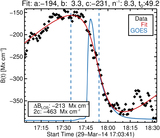
Temporal evolution of the magnetic field during an M9.3 flare located at ﹩\mu =0.82﹩. Red, blue, and green lines show the best fit of Equation (1), the GOES 1–8 Å SXR light curve, and the AIA 1600 Å light curve at the same position where the ﹩{\rm{\Delta }}{B}_{\mathrm{LOS}}﹩ took place, respectively. Vertical blue, red, and magenta lines are the GOES start time, and the ﹩{\rm{\Delta }}{B}_{\mathrm{LOS}}﹩ start time calculated as ﹩{t}_{s}={t}_{0}-\pi /n﹩, and the ﹩{\rm{\Delta }}{B}_{\mathrm{LOS}}﹩ start time calculated as ﹩{t}_{s}^{{\prime} }={t}_{0}-\pi /(2n)﹩, respectively. The stepwise change may have started before the SXR and chromospheric emission.
Other Images in This Article
Copyright and Terms & Conditions
© 2018. The American Astronomical Society. All rights reserved.