Image Details
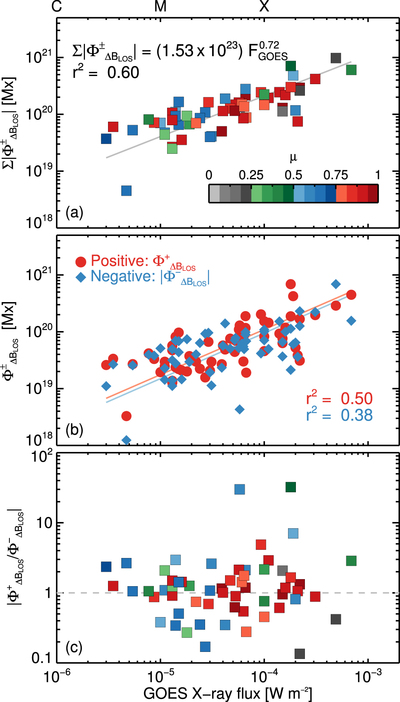
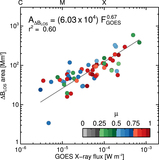
Caption: Figure 7.
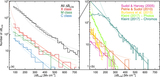
Integrated magnetic flux change as a function of the peak GOES X-ray flux of each flare. Top: integrated unsigned magnetic flux change ﹩{\rm{\Sigma }}| {{\rm{\Phi }}}_{{\rm{\Delta }}{B}_{\mathrm{LOS}}}^{\pm }| ﹩ as a function of the peak GOES X-ray flux. The color-coded squares denote the center-to-limb distance μ of each event. Middle: integrated signed magnetic flux change ﹩{{\rm{\Phi }}}_{{\rm{\Delta }}{B}_{\mathrm{LOS}}}^{\pm }﹩ as a function of the peak GOES X-ray flux. Red circles and blue diamonds illustrate the total positive and negative flux change, respectively. Straight lines are the best fit of a power-law model ﹩{\rm{\Phi }}({F}_{{GOES}})\propto {F}_{{GOES}}^{\delta }﹩, with exponent ﹩{\delta }_{| {\rm{\Phi }}| }=0.72﹩. Bottom: ratio between the integrated positive and negative changes. A logarithmic scale is used to better illustrate the ratios between 0 and 1. Squares are color-coded identically to panel (a). More energetic flares tend to change larger magnetic fluxes, but the scatter in the ratio ﹩| {{\rm{\Phi }}}_{{\rm{\Delta }}{B}_{\mathrm{LOS}}}^{+}/{{\rm{\Phi }}}_{{\rm{\Delta }}{B}_{\mathrm{LOS}}}^{-}| ﹩ is large, which indicates that positive or negative changes do not depend on the flare class.
Other Images in This Article
Copyright and Terms & Conditions
© 2018. The American Astronomical Society. All rights reserved.