Image Details
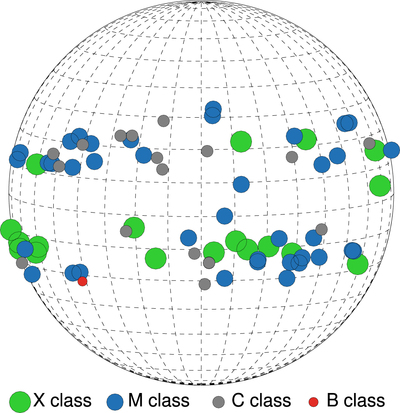
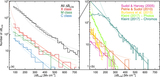
Caption: Figure 1.
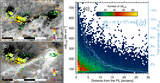
Distribution of the flare sample on the solar disk. Color-coded circles show the flare locations, where more energetic flares are associated with larger circles. Colors represent X- (green), M- (blue), C- (gray), and B-class (red) flares. Solar longitudes and latitudes are drawn with dashed lines every 10°.
Other Images in This Article
Copyright and Terms & Conditions
© 2018. The American Astronomical Society. All rights reserved.
Copyright ©
2026 Astronomy Image Explorer. All Rights Reserved.