Image Details
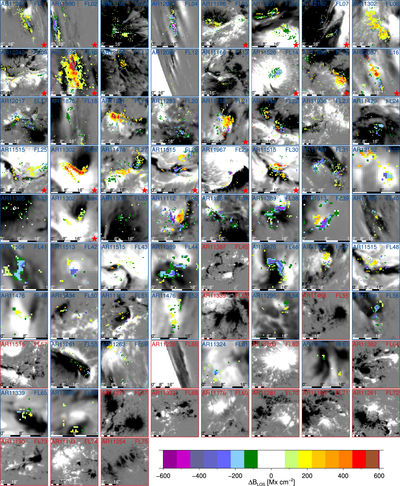
Caption: Figure 4.
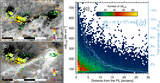
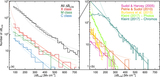
Entire sample of ﹩{\rm{\Delta }}{B}_{\mathrm{LOS}}﹩. All flare-related changes of the evolution of ﹩{B}_{\mathrm{LOS}}(t)﹩ are plotted on magnetograms. Color-coded pixels are locations with ﹩{\rm{\Delta }}{B}_{\mathrm{LOS}}﹩ clipped at ±600 Mx cm−2 according to the color bar on the bottom. The magnetogram image in the background was taken at the peak of each flare, and clipped at ±800 Mx cm−2. Blue axes and labels are used for flares where ﹩{\rm{\Delta }}{B}_{\mathrm{LOS}}﹩ were found. Red axes and labels represent flares without ﹩{\rm{\Delta }}{B}_{\mathrm{LOS}}﹩. Image scales are shown by the black and white dashed bars with a length of 16″ divided into four parts of 4″ each. The FoVs correspond to the black boxes in Figure 2. Red stars denote the 18 flares that in addition to classical stepwise changes, also showed other types of temporal evolutions of ﹩{B}_{\mathrm{LOS}}(t)﹩ (see Section 2.2). It is visible that ﹩{\rm{\Delta }}{B}_{\mathrm{LOS}}﹩ occur in kernels and preferentially near opposite polarities.
Other Images in This Article
Copyright and Terms & Conditions
© 2018. The American Astronomical Society. All rights reserved.