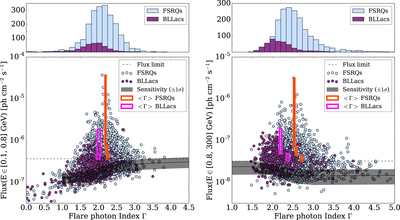
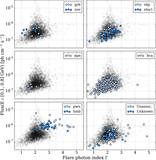
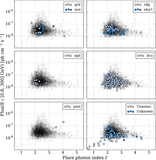
Image Details

Choose export citation format:

The Second Catalog of Flaring Gamma-Ray Sources from the Fermi All-sky Variability Analysis

  • Authors: S. Abdollahi, M. Ackermann, M. Ajello, A. Albert, L. Baldini, J. Ballet, G. Barbiellini, D. Bastieri, J. Becerra Gonzalez, R. Bellazzini, E. Bissaldi, R. D. Blandford, E. D. Bloom, R. Bonino, E. Bottacini, J. Bregeon, P. Bruel, R. Buehler, S. Buson, R. A. Cameron, M. Caragiulo, P. A. Caraveo, E. Cavazzuti, C. Cecchi, A. Chekhtman, C. C. Cheung, G. Chiaro, S. Ciprini, J. Conrad, D. Costantin, F. Costanza, S. Cutini, F. D'Ammando, F. de Palma, A. Desai, R. Desiante, S. W. Digel, N. Di Lalla, M. Di Mauro, L. Di Venere, B. Donaggio, P. S. Drell, C. Favuzzi, S. J. Fegan, E. C. Ferrara, W. B. Focke, A. Franckowiak, Y. Fukazawa, S. Funk, P. Fusco, F. Gargano, D. Gasparrini, N. Giglietto, M. Giomi, F. Giordano, M. Giroletti, T. Glanzman, D. Green, I. A. Grenier, J. E. Grove, L. Guillemot, S. Guiriec, E. Hays, D. Horan, T. Jogler, G. Jóhannesson, A. S. Johnson, D. Kocevski, M. Kuss, G. La Mura, S. Larsson, L. Latronico, J. Li, F. Longo, F. Loparco, M. N. Lovellette, P. Lubrano, J. D. Magill, S. Maldera, A. Manfreda, M. Mayer, M. N. Mazziotta, P. F. Michelson, W. Mitthumsiri, T. Mizuno, M. E. Monzani, A. Morselli, I. V. Moskalenko, M. Negro, E. Nuss, T. Ohsugi, N. Omodei, M. Orienti, E. Orlando, V. S. Paliya, D. Paneque, J. S. Perkins, M. Persic, M. Pesce-Rollins, V. Petrosian, F. Piron, T. A. Porter, G. Principe, S. Rainò, R. Rando, M. Razzano, S. Razzaque, A. Reimer, O. Reimer, C. Sgrò, D. Simone, E. J. Siskind, F. Spada, G. Spandre, P. Spinelli, L. Stawarz, D. J. Suson, M. Takahashi, K. Tanaka, J. B. Thayer, D. J. Thompson, D. F. Torres, E. Torresi, G. Tosti, E. Troja, G. Vianello, and K. S. Wood

2017 The Astrophysical Journal 846 34.

  • Provider: AAS Journals

Caption: Figure 7.

Parameters of the low-energy (left) and high-energy (right) spectra for flares of 2FAV sources associated with FSRQs and BL Lacs. Individual flares are plotted in shades of blue. The gray band represents the average sensitivity (not accounting for the likelihood follow-up) computed at the position of the sources (solid black line), plus or minus one standard deviation. The dotted line represents the flux limit, chosen as the average sensitivity plus one standard deviation, for ﹩{\rm{\Gamma }}=3.5﹩ and ﹩{\rm{\Gamma }}=1.5﹩ at low and high energies, respectively; see the text for details. Magenta and violet boxes show the mean photon index for different flux bins above the flux threshold (black dotted line) for FSRQs and BL Lacs, respectively. The size of the boxes indicates the width of the flux bin (in the y-direction) and the error on the mean photon index (x-direction). The top panels show the distribution of the photon index of the flares in the two respective energy bands.

Other Images in This Article
Copyright and Terms & Conditions