Image Details
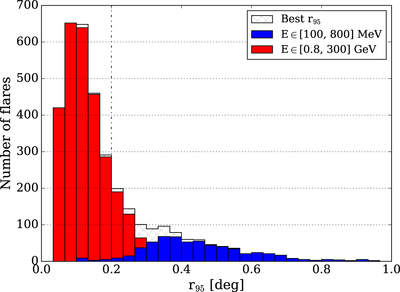
Caption: Figure 3.
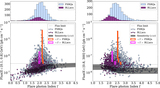
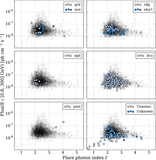
Distribution of r95 for the individual 2FAV flares. Red: positions from high-energy analysis; blue: positions from low-energy analysis; hatched black: r95 from the analysis that provides the best flare position. The dotted line marks the division between the better localized flares used in the very first step of the clustering, and the ones added in the second step. See Section 3 for details.
Other Images in This Article
Copyright and Terms & Conditions
© 2017. The American Astronomical Society. All rights reserved.
Copyright ©
2025 Astronomy Image Explorer. All Rights Reserved.