Image Details
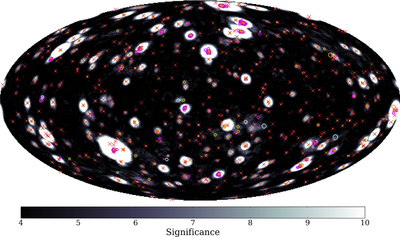
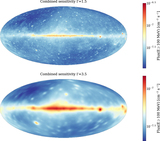
Caption: Figure 5.
Positions of 2FAV sources and flares on the sky in Galactic coordinates and Hammer–Aitoff projection. The background image shows the maximum significance detected for each pixel, in either the low- or high-energy band. The red crosses represent the 2FAV sources. The flares used to construct the 2FAV are also shown: yellow circles are flares with the best determined position from the TS maps. Flares with worse TS map positioning are in orange if they have been assigned to a cluster, or cyan otherwise. Flares with only FAVA positions are in magenta if they have been assigned to a cluster, green if they constitute a separate cluster. For all of the flares, the radius of the drawn circles is equal to r95.
Other Images in This Article
Copyright and Terms & Conditions
© 2017. The American Astronomical Society. All rights reserved.