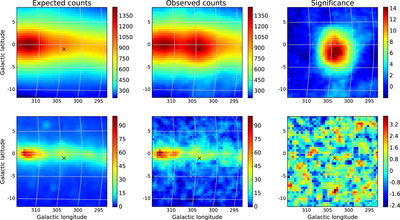
Image Details

Choose export citation format:

The Second Catalog of Flaring Gamma-Ray Sources from the Fermi All-sky Variability Analysis

  • Authors: S. Abdollahi, M. Ackermann, M. Ajello, A. Albert, L. Baldini, J. Ballet, G. Barbiellini, D. Bastieri, J. Becerra Gonzalez, R. Bellazzini, E. Bissaldi, R. D. Blandford, E. D. Bloom, R. Bonino, E. Bottacini, J. Bregeon, P. Bruel, R. Buehler, S. Buson, R. A. Cameron, M. Caragiulo, P. A. Caraveo, E. Cavazzuti, C. Cecchi, A. Chekhtman, C. C. Cheung, G. Chiaro, S. Ciprini, J. Conrad, D. Costantin, F. Costanza, S. Cutini, F. D'Ammando, F. de Palma, A. Desai, R. Desiante, S. W. Digel, N. Di Lalla, M. Di Mauro, L. Di Venere, B. Donaggio, P. S. Drell, C. Favuzzi, S. J. Fegan, E. C. Ferrara, W. B. Focke, A. Franckowiak, Y. Fukazawa, S. Funk, P. Fusco, F. Gargano, D. Gasparrini, N. Giglietto, M. Giomi, F. Giordano, M. Giroletti, T. Glanzman, D. Green, I. A. Grenier, J. E. Grove, L. Guillemot, S. Guiriec, E. Hays, D. Horan, T. Jogler, G. Jóhannesson, A. S. Johnson, D. Kocevski, M. Kuss, G. La Mura, S. Larsson, L. Latronico, J. Li, F. Longo, F. Loparco, M. N. Lovellette, P. Lubrano, J. D. Magill, S. Maldera, A. Manfreda, M. Mayer, M. N. Mazziotta, P. F. Michelson, W. Mitthumsiri, T. Mizuno, M. E. Monzani, A. Morselli, I. V. Moskalenko, M. Negro, E. Nuss, T. Ohsugi, N. Omodei, M. Orienti, E. Orlando, V. S. Paliya, D. Paneque, J. S. Perkins, M. Persic, M. Pesce-Rollins, V. Petrosian, F. Piron, T. A. Porter, G. Principe, S. Rainò, R. Rando, M. Razzano, S. Razzaque, A. Reimer, O. Reimer, C. Sgrò, D. Simone, E. J. Siskind, F. Spada, G. Spandre, P. Spinelli, L. Stawarz, D. J. Suson, M. Takahashi, K. Tanaka, J. B. Thayer, D. J. Thompson, D. F. Torres, E. Torresi, G. Tosti, E. Troja, G. Vianello, and K. S. Wood

2017 The Astrophysical Journal 846 34.

  • Provider: AAS Journals

Caption: Figure 1.

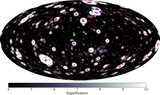
Examples of FAVA maps for the bright flare associated with one of the periastron passages of PSR B1259−63/LS 2883. The maps represent the analysis for the time bin [316971818, 317576618] MET, around MJD 55582. Only a ﹩20^\circ \times 20^\circ ﹩ region centered on the flare position is shown. The maps are arranged as follows: expected counts (left), observed counts (center), significance expressed in Gaussian sigma (right). Upper row: 0.1–0.8 GeV, lower row: 0.8–300 GeV. The black “x” marks the position of PSR B1259−63.

Other Images in This Article
Copyright and Terms & Conditions