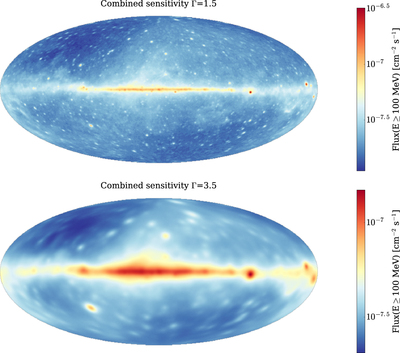
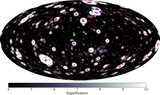
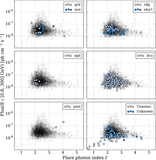
Image Details

Choose export citation format:

The Second Catalog of Flaring Gamma-Ray Sources from the Fermi All-sky Variability Analysis

  • Authors: S. Abdollahi, M. Ackermann, M. Ajello, A. Albert, L. Baldini, J. Ballet, G. Barbiellini, D. Bastieri, J. Becerra Gonzalez, R. Bellazzini, E. Bissaldi, R. D. Blandford, E. D. Bloom, R. Bonino, E. Bottacini, J. Bregeon, P. Bruel, R. Buehler, S. Buson, R. A. Cameron, M. Caragiulo, P. A. Caraveo, E. Cavazzuti, C. Cecchi, A. Chekhtman, C. C. Cheung, G. Chiaro, S. Ciprini, J. Conrad, D. Costantin, F. Costanza, S. Cutini, F. D'Ammando, F. de Palma, A. Desai, R. Desiante, S. W. Digel, N. Di Lalla, M. Di Mauro, L. Di Venere, B. Donaggio, P. S. Drell, C. Favuzzi, S. J. Fegan, E. C. Ferrara, W. B. Focke, A. Franckowiak, Y. Fukazawa, S. Funk, P. Fusco, F. Gargano, D. Gasparrini, N. Giglietto, M. Giomi, F. Giordano, M. Giroletti, T. Glanzman, D. Green, I. A. Grenier, J. E. Grove, L. Guillemot, S. Guiriec, E. Hays, D. Horan, T. Jogler, G. Jóhannesson, A. S. Johnson, D. Kocevski, M. Kuss, G. La Mura, S. Larsson, L. Latronico, J. Li, F. Longo, F. Loparco, M. N. Lovellette, P. Lubrano, J. D. Magill, S. Maldera, A. Manfreda, M. Mayer, M. N. Mazziotta, P. F. Michelson, W. Mitthumsiri, T. Mizuno, M. E. Monzani, A. Morselli, I. V. Moskalenko, M. Negro, E. Nuss, T. Ohsugi, N. Omodei, M. Orienti, E. Orlando, V. S. Paliya, D. Paneque, J. S. Perkins, M. Persic, M. Pesce-Rollins, V. Petrosian, F. Piron, T. A. Porter, G. Principe, S. Rainò, R. Rando, M. Razzano, S. Razzaque, A. Reimer, O. Reimer, C. Sgrò, D. Simone, E. J. Siskind, F. Spada, G. Spandre, P. Spinelli, L. Stawarz, D. J. Suson, M. Takahashi, K. Tanaka, J. B. Thayer, D. J. Thompson, D. F. Torres, E. Torresi, G. Tosti, E. Troja, G. Vianello, and K. S. Wood

2017 The Astrophysical Journal 846 34.

  • Provider: AAS Journals

Caption: Figure 4.

Sensitivity for the flare detection of the photometric FAVA analysis (see Section 3 for details). These maps shows the minimum flux increase, in a one-week time bin, that corresponds to a FAVA significance greater than ﹩6\sigma ﹩ in one of the two FAVA energy bands or greater than ﹩4\sigma ﹩ in both energy bands simultaneously. The maps are computed assuming a power-law spectrum for the flaring source, the average weekly exposure, and for two reference values of the photon index Γ. Top panel: spectrally hard flares (﹩{\rm{\Gamma }}=1.5﹩), bottom: soft flares (﹩{\rm{\Gamma }}=3.5﹩). The maps are shown in Galactic coordinates and in Hammer–Aitoff projection.

Other Images in This Article
Copyright and Terms & Conditions