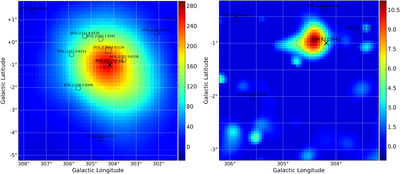
Image Details

Choose export citation format:

The Second Catalog of Flaring Gamma-Ray Sources from the Fermi All-sky Variability Analysis

  • Authors: S. Abdollahi, M. Ackermann, M. Ajello, A. Albert, L. Baldini, J. Ballet, G. Barbiellini, D. Bastieri, J. Becerra Gonzalez, R. Bellazzini, E. Bissaldi, R. D. Blandford, E. D. Bloom, R. Bonino, E. Bottacini, J. Bregeon, P. Bruel, R. Buehler, S. Buson, R. A. Cameron, M. Caragiulo, P. A. Caraveo, E. Cavazzuti, C. Cecchi, A. Chekhtman, C. C. Cheung, G. Chiaro, S. Ciprini, J. Conrad, D. Costantin, F. Costanza, S. Cutini, F. D'Ammando, F. de Palma, A. Desai, R. Desiante, S. W. Digel, N. Di Lalla, M. Di Mauro, L. Di Venere, B. Donaggio, P. S. Drell, C. Favuzzi, S. J. Fegan, E. C. Ferrara, W. B. Focke, A. Franckowiak, Y. Fukazawa, S. Funk, P. Fusco, F. Gargano, D. Gasparrini, N. Giglietto, M. Giomi, F. Giordano, M. Giroletti, T. Glanzman, D. Green, I. A. Grenier, J. E. Grove, L. Guillemot, S. Guiriec, E. Hays, D. Horan, T. Jogler, G. Jóhannesson, A. S. Johnson, D. Kocevski, M. Kuss, G. La Mura, S. Larsson, L. Latronico, J. Li, F. Longo, F. Loparco, M. N. Lovellette, P. Lubrano, J. D. Magill, S. Maldera, A. Manfreda, M. Mayer, M. N. Mazziotta, P. F. Michelson, W. Mitthumsiri, T. Mizuno, M. E. Monzani, A. Morselli, I. V. Moskalenko, M. Negro, E. Nuss, T. Ohsugi, N. Omodei, M. Orienti, E. Orlando, V. S. Paliya, D. Paneque, J. S. Perkins, M. Persic, M. Pesce-Rollins, V. Petrosian, F. Piron, T. A. Porter, G. Principe, S. Rainò, R. Rando, M. Razzano, S. Razzaque, A. Reimer, O. Reimer, C. Sgrò, D. Simone, E. J. Siskind, F. Spada, G. Spandre, P. Spinelli, L. Stawarz, D. J. Suson, M. Takahashi, K. Tanaka, J. B. Thayer, D. J. Thompson, D. F. Torres, E. Torresi, G. Tosti, E. Troja, G. Vianello, and K. S. Wood

2017 The Astrophysical Journal 846 34.

  • Provider: AAS Journals

Caption: Figure 2.

Examples of the TS maps generated by the automatic likelihood follow-up analysis. The maps are referred to the bright low-energy flare associated with the first periastron passage of the binary system PSR B1259−63/LS 2883 detected by FAVA; see Figures 1 and 6. The values of TS can be read from the color scale. The left panel shows the TS map at low energies, 0.1–0.8 GeV. The right panel shows the TS map at high energies, 0.8–300 GeV. Note the different angular sizes (﹩7^\circ \times 7^\circ ﹩ for the TS map at low energies and ﹩3^\circ \times 3^\circ ﹩ at high energies) and centering of the maps. The dashed line around the maximum marks the 95% CL contour. This flare is soft (﹩{\rm{\Gamma }}=3﹩), resulting in a much higher detection significance in the low-energy band. The positions and uncertainties of the closest 3FGL sources included in the sky model used for the analysis are also shown as circles (or squares, in the case of extended sources). The black “x” marks the position of PSR B1259−63.

Other Images in This Article
Copyright and Terms & Conditions