Image Details
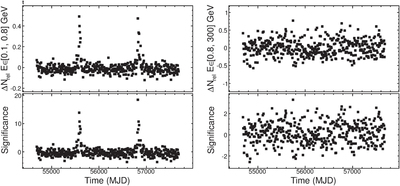
Caption: Figure 6.
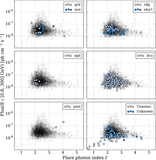
Weekly light curves from the direction of the pulsar binary system PSR B1259−63/LS 2883 (2FAV J1302−63.7). The top panels show the relative variation of counts, ﹩{\rm{\Delta }}{N}_{\mathrm{rel}}=(N-{N}^{\exp })/{N}^{\exp },﹩ where N is the number of observed counts in a given time bin and Nexp is the number of expected counts. The bottom panels show the significance that corresponds to these counts variations. Plots on the left refer to low-energy analysis, while the ones on the right refer to high-energy analysis.
Other Images in This Article
Copyright and Terms & Conditions
© 2017. The American Astronomical Society. All rights reserved.
Copyright ©
2025 Astronomy Image Explorer. All Rights Reserved.