Image Details
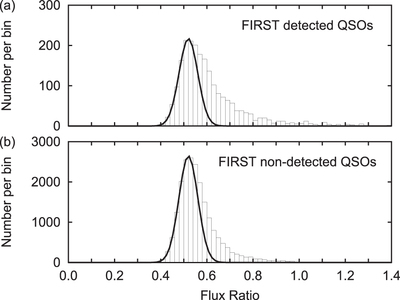
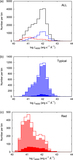
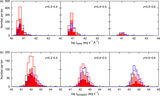
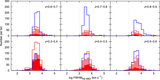
Caption: Figure 9.
(a) Number distribution of the QSOs with FIRST detection at different flux ratios. (b) Number distribution of the QSOs within the FIRST sky coverage but without FIRST detection. The number bin width is 0.02. The black curve in each figure is a Gaussian fitting. In both figures, the peak centers are at flux ratio rpeak = 0.52, and σ ≈ 0.041.
Other Images in This Article
Copyright and Terms & Conditions
© 2017. The American Astronomical Society. All rights reserved.
Copyright ©
2025 Astronomy Image Explorer. All Rights Reserved.