Image Details
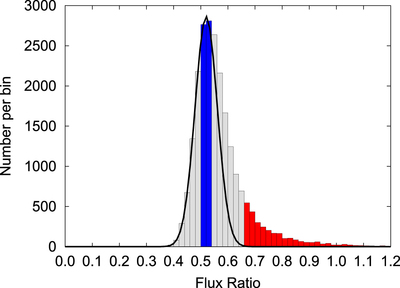
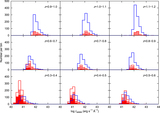
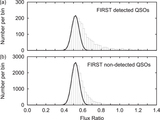
Caption: Figure 3.
Number distributions of the QSO samples vs. the continuum flux ratios of 4000 to 3000 Å within the FIRST sky coverage. The number bin width is 0.02. The black curve is a Gaussian fitting with peak center at flux ratio rpeak = 0.52, and σ ≈ 0.042. We select QSOs with flux ratio ﹩{r}_{\mathrm{peak}}\pm \tfrac{1}{2}\sigma ﹩, i.e., 0.50 ≤ r ≤ 0.54, as tQSOs (blue color), and QSOs with flux ratio r ≥ 0.66 as rQSOs (red color). The other QSOs are shown in gray color.
Other Images in This Article
Copyright and Terms & Conditions
© 2017. The American Astronomical Society. All rights reserved.
Copyright ©
2025 Astronomy Image Explorer. All Rights Reserved.