Image Details
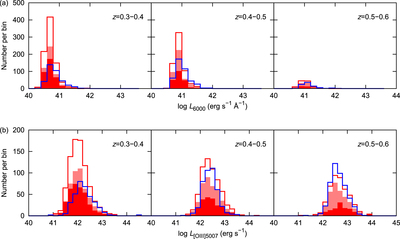
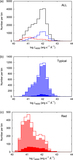
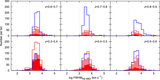
Caption: Figure 10.
(a) Number distributions of different types of QSOs vs. log(L6000) at 0.3 < z < 0.6. (b) Number distributions of different types of QSOs vs. log(﹩{L}_{[{\rm{O}}{\rm{III}}]5007}﹩) at 0.3 < z < 0.6. The blue solid line represents the tQSOs with flux ratios of 0.50 ≤ r ≤ 0.54. The red solid line represents the rQSOs with flux ratios ≥0.66. The filled light-red histogram represents the rQSOs with flux ratios of 0.66 ≤ r < 0.80. The filled red histogram represents the rQSOs with flux ratios ≥0.80. The values of the number, median, and standard deviation for the L6000 and ﹩{L}_{[{\rm{O}}{\rm{III}}]5007}﹩ distributions of the rQSOs and the tQSOs are listed in Table 7. The t-test results for the L6000 and ﹩{L}_{[{\rm{O}}{\rm{III}}]5007}﹩ distributions between the rQSOs and the tQSOs are listed in Table 8.
Other Images in This Article
Copyright and Terms & Conditions
© 2017. The American Astronomical Society. All rights reserved.