Image Details
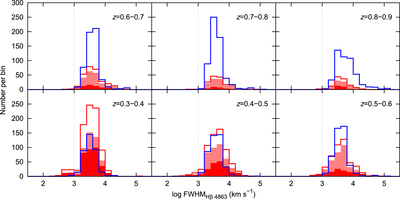
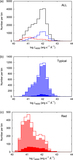
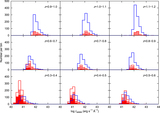
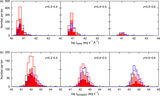
Caption: Figure 11.
Number distributions of different types of QSOs vs. log(FWHMHβ 4863) at 0.3 < z < 0.9. Log(FWHMHβ 4863) is the Gaussian-fit FWHM of the Hβ emission line obtained from the SDSS database. The blue solid line represents the tQSOs with flux ratios of 0.50 ≤ r ≤ 0.54. The red solid line represents the rQSOs with flux ratios ≥0.66. The filled light-red histogram represents the rQSOs with flux ratios of 0.66 ≤ r < 0.80. The filled red histogram represents the rQSOs with flux ratios ≥0.80. The dotted line represents the Hβ FWHM of 1000 km s−1. The number of QSOs with Hβ FWHM < 1000 km s−1 is listed in Table 9.
Other Images in This Article
Copyright and Terms & Conditions
© 2017. The American Astronomical Society. All rights reserved.
Copyright ©
2025 Astronomy Image Explorer. All Rights Reserved.