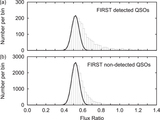
Image Details
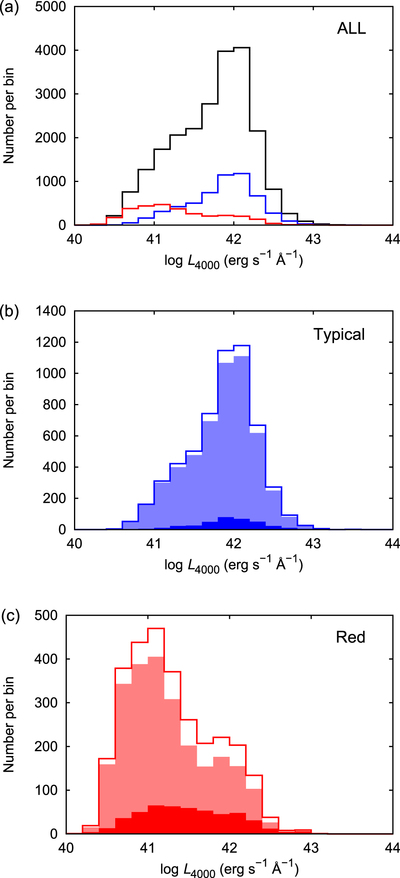
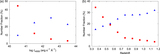
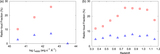
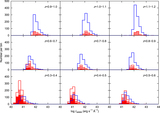
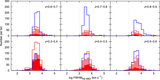
Caption: Figure 4.
Number distributions of different types of QSOs at different luminosities. (a) Comparison between the tQSOs and the rQSOs. The black solid line represents the entire QSO sample, the blue solid line represents the tQSOs, and the red solid line represents the rQSOs. (b) Comparison between the radio-quiet and the radio-loud sources within the tQSOs. The blue solid line represents the tQSOs, the filled light-blue histogram represents the tRQQs, and the filled blue histogram represents the tRLQs. (c) Comparison between the radio-quiet and the radio-loud sources within the rQSOs. The red solid line represents the rQSOs, the filled light-red histogram represents the rRQQs, and the filled red histogram represents the rRLQs.
Other Images in This Article
Copyright and Terms & Conditions
© 2017. The American Astronomical Society. All rights reserved.