Image Details
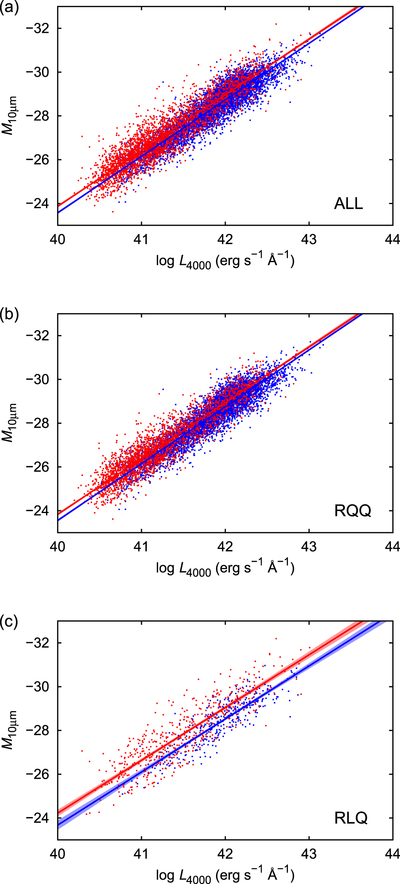
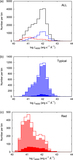
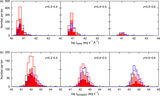
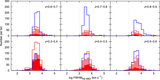
Caption: Figure 8.
Absolute magnitude of 10 μm vs. log(L4000) for (a) the whole QSO sample, (b) the RQQs, and (c) the RLQs. The blue dots are the tQSOs, and the red dots are the rQSOs. The blue line and the red line are the linear χ2 fitting of the tQSOs and the rQSOs, respectively. The blue shadow and the red shadow in each figure are the 95% confidence intervals of the tQSOs and the rQSOs, respectively. Note that the confidence intervals are too small to be easily visible for (a) and (b), but is still visible for (c).
Other Images in This Article
Copyright and Terms & Conditions
© 2017. The American Astronomical Society. All rights reserved.
Copyright ©
2025 Astronomy Image Explorer. All Rights Reserved.