Image Details
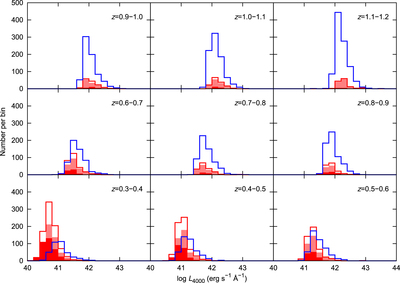
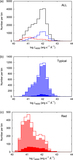
Caption: Figure 7.
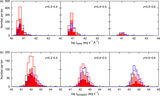
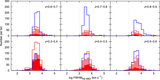
Number distributions of different types of QSOs vs. different luminosities at different redshifts. The blue solid line represents the tQSOs with flux ratios of 0.50 ≤ r ≤ 0.54. The red solid line represents the rQSOs with flux ratios ≥0.66. The filled light-red histogram represents the rQSOs with flux ratios of 0.66 ≤ r < 0.80. The filled red histogram represents the rQSOs with flux ratios ≥0.80. See more information on different types of QSOs in Table 7.
Other Images in This Article
Copyright and Terms & Conditions
© 2017. The American Astronomical Society. All rights reserved.
Copyright ©
2025 Astronomy Image Explorer. All Rights Reserved.