Image Details
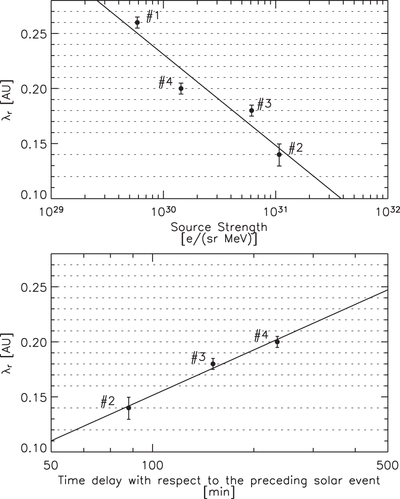
Caption: Figure 9.
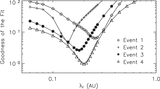
Mean-free path ﹩{\lambda }_{r}﹩ vs. maximum intensity of particle release (top panel) and time delay with respect to the preceding solar release (bottom panel) for the four events under study. The solid line shows a linear fit. The horizontal dotted lines mark the resolution of the grid in ﹩{\lambda }_{r}﹩. Error bars show an estimate of the uncertainty in ﹩{\lambda }_{r}﹩.
Other Images in This Article
Copyright and Terms & Conditions
© 2016. The American Astronomical Society. All rights reserved.
Copyright ©
2026 Astronomy Image Explorer. All Rights Reserved.