Image Details
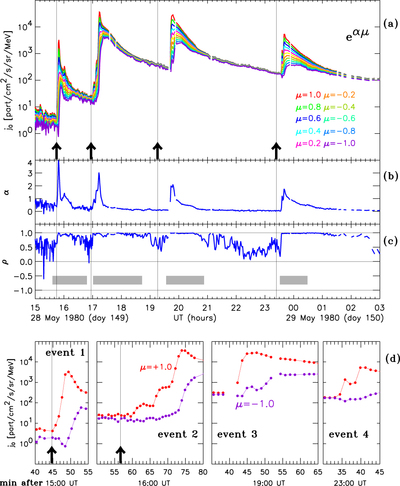
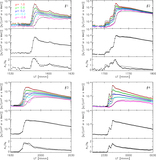
Caption: Figure 5.
(a) One-minute averages of the 300–800 keV electron intensity time profiles at specific pitch-angle cosines assuming that the PADs shown in Figure 2(a) can be approximated by ﹩j={j}_{0}{e}^{\alpha \mu }﹩. (b) Values of α obtained from fitting the PADs formed by the eight sectors of E6. (c) Linear Pearson correlation coefficient. The gray rectangles show the time period selected for modeling in Section 3.2. (d) Time-intensity profiles at pitch-angle cosine μ = 1 (red) and μ = −1 (purple) at the onset of the events.
Other Images in This Article
Copyright and Terms & Conditions
© 2016. The American Astronomical Society. All rights reserved.
Copyright ©
2026 Astronomy Image Explorer. All Rights Reserved.