Image Details
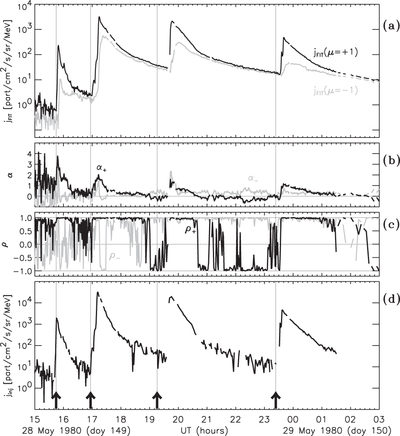
Caption: Figure 3.
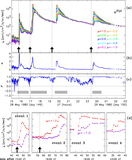
(a) ﹩{j}_{\mathrm{FIT}}(\mu ,t)﹩ and (b) α parameters obtained from fitting the pitch-angle distributions to the outgoing (black) and returning (gray) particles using the 300–800 keV electron intensities measured in the eight sectors of E6 as shown in Figure 2(a). (c) Linear Pearson correlation coefficient obtained from the fitting of the PADs of the outgoing (black) and returning (gray) particles. (d) Solar injection history for electrons with μ = 1. Gaps in the solar injection function result from either actual gaps in the particle data or periods of time when the time resolution of the data does not allow us to have a data point near the estimated time ﹩t-2{\tau }_{m}﹩ in Equation (5). The vertical black lines and black arrows identify the onset of the SXR emissions shifted by 8.33 minutes.
Other Images in This Article
Copyright and Terms & Conditions
© 2016. The American Astronomical Society. All rights reserved.