Image Details
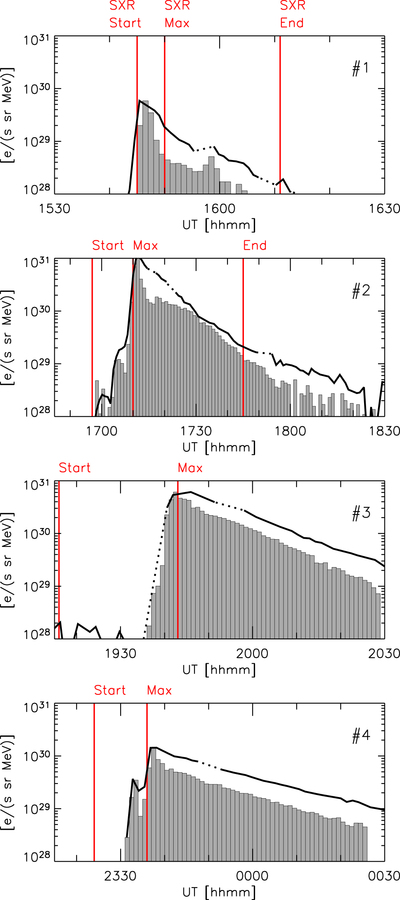
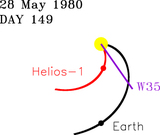
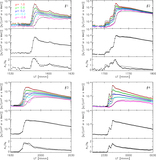
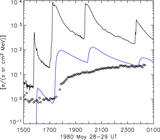
Caption: Figure 8.
Release time profiles inferred for the four events. The histograms show the inversion results with one-minute time resolution. The black thick curves show the results extracted using the algorithm of Roelof (2008) re-normalized to the inversion result maximum. The vertical red lines show the start, maximum, and end time (in some cases) of the SXR emission shifted by 8.33 minutes.
Other Images in This Article
Copyright and Terms & Conditions
© 2016. The American Astronomical Society. All rights reserved.
Copyright ©
2026 Astronomy Image Explorer. All Rights Reserved.