Image Details
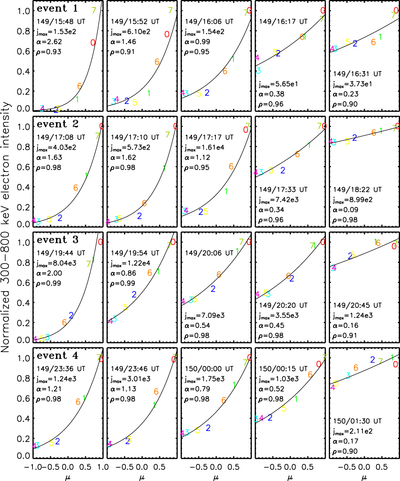
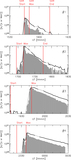
Caption: Figure 4.
Observational sectored intensities (colored numbers from 0 to 7) normalized to the intensity measured in the sector with maximum number of counts (jmax) as a function of the pitch-angle cosine μ for five snapshots of each event. The values of jmax listed in each panel are in units of counts (cm2 s sr MeV)−1. The thin black traces show the least-squares fit using the expression ﹩{e}^{\alpha \mu }﹩. The values of α and the linear Pearson correlation coefficient ρ obtained from the fit are listed in each panel.
Other Images in This Article
Copyright and Terms & Conditions
© 2016. The American Astronomical Society. All rights reserved.
Copyright ©
2026 Astronomy Image Explorer. All Rights Reserved.