Image Details
Caption: Figure 7.
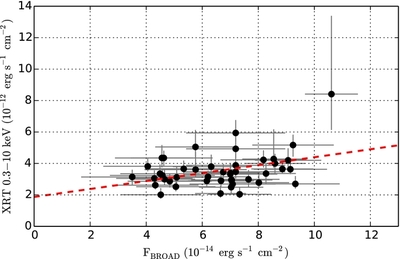
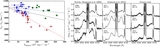
Correlation between X-ray and optical data, where black points represent the fluxes of the X-ray band and the broad profile for the same MJD (after interpolation of the optical light curve to match the epochs of Swift observations). The red dashed line is the best linear correlation between the data. The median value of the correlation coefficient is  which corresponds to a level of significance of 56.8%–98.4%.
Other Images in This Article
Copyright and Terms & Conditions
© 2015. The American Astronomical Society. All rights reserved.
Copyright ©
2025 Astronomy Image Explorer. All Rights Reserved.