Image Details
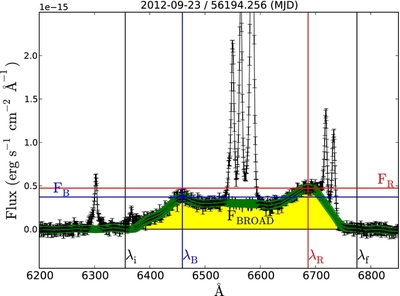
Caption: Figure 3.
Visual representation of the measured properties of the Hα double-peaked profile for the observation of MJD56194. The vertical black lines mark λi and λf (respectively the lower and upper wavelength limits of the double-peaked profile). The horizontal blue line marks the maximum flux value for the blue peak, FB, while the vertical blue line marks λB, the wavelength where FB occurs. The maximum flux of the red peak FR is marked by the horizontal red line, while λR is marked by the vertical red line. The green strip represents the Gaussian smoothing of the spectrum. The yellow region represents Fbroad, after subtracting the contribution of the narrow emission lines.
Other Images in This Article
Copyright and Terms & Conditions
© 2015. The American Astronomical Society. All rights reserved.