Image Details
Caption: Figure 1.
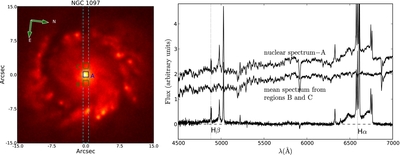
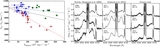
Left: acquisition image of the nuclear region of NGC 1097 from the SOAR observation of MJD56194. The cyan dashed line represents the slit (width of 1![]() 03). The blue square (A) shows the extraction window (1
03). The blue square (A) shows the extraction window (1![]() 03 × 1
03 × 1![]() 0) of the nuclear spectrum. The green squares (B and C), centered at 2
0) of the nuclear spectrum. The green squares (B and C), centered at 2![]() 0 from the nucleus show the windows used to extract stellar population spectra. Right: (a) top: nuclear spectrum extracted from window A; (b) middle: mean spectrum of B and C, adopted as representative of the nuclear stellar population; (c) bottom: difference between (a) and (b) (after scaling), which isolates the nuclear emission.
0 from the nucleus show the windows used to extract stellar population spectra. Right: (a) top: nuclear spectrum extracted from window A; (b) middle: mean spectrum of B and C, adopted as representative of the nuclear stellar population; (c) bottom: difference between (a) and (b) (after scaling), which isolates the nuclear emission.
Other Images in This Article
Copyright and Terms & Conditions
© 2015. The American Astronomical Society. All rights reserved.
Copyright ©
2025 Astronomy Image Explorer. All Rights Reserved.