Image Details
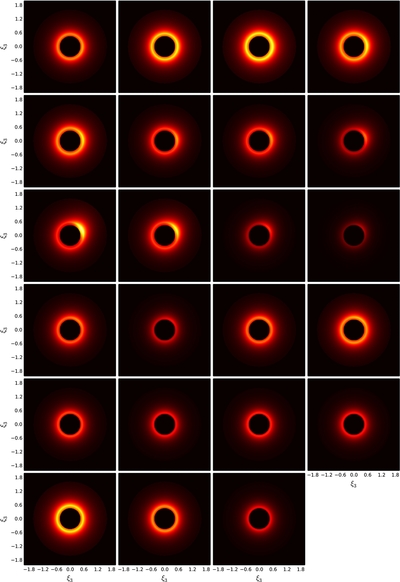
Caption: Figure 6.
Image showing the disk emissivity utilized to model the double-peaked profile for each epoch of observation of Figure 2. White represents the brightest regions, and the observer is to the bottom. The disk parameters for these epochs are listed in Table 5. On each frame the axis is expressed in terms of ξ3 = 10−3ξ.
Other Images in This Article
Copyright and Terms & Conditions
© 2015. The American Astronomical Society. All rights reserved.
Copyright ©
2025 Astronomy Image Explorer. All Rights Reserved.