Image Details
Caption: Figure 4.
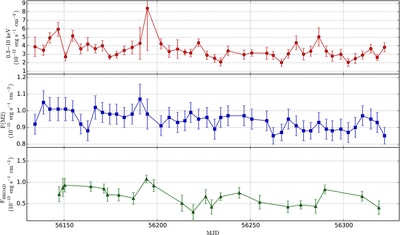
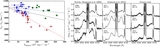
Light curves. Top: integrated flux of the Swift/XRT X-ray band, 0.3–10 keV. Middle: UV integrated flux, from the M2 band (~2246 Å) of Swift/UVOT. Bottom: integrated Hα broad-line flux. The largest average variation was observed for the Hα profile, of 20%, followed by the X-rays, which varied by 13%, while the UV did not show significant variation.
Other Images in This Article
Copyright and Terms & Conditions
© 2015. The American Astronomical Society. All rights reserved.
Copyright ©
2025 Astronomy Image Explorer. All Rights Reserved.