Image Details
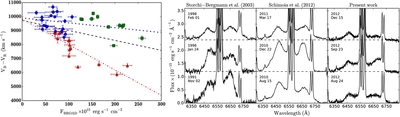
Caption: Figure 5.
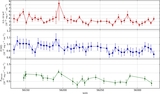
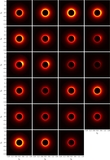
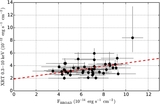
Left: comparison of the relation between the integrated Hα flux, Fbroad, and velocity separation between the blue and red peaks, ΔV = VB − VR, for three different monitoring campaigns. The data from the present work are shown as blue circles; the data from Storchi-Bergmann et al. (2003) are shown as red triangles, and the data from Schimoia et al. (2012) are shown as green squares. The comparison shows that during this campaign Fbroad remained at the lowest fluxes ever seen while VB − VR was at a very large separation. This trend is in agreement with that of the previous observations. The blue dotted line represents the linear regression for the data from Schimoia et al. (2012) + that of this work (r ~ −0.343); while the dot–dashed line is the linear regression for the data from Storchi-Bergmann et al. (2003) alone (r ~ −0.823). The black dashed line is the linear regression for all the data together (r ~ −0.354). Right: three representative profiles of each of the three time periods covered by our previous and present work.
Other Images in This Article
Copyright and Terms & Conditions
© 2015. The American Astronomical Society. All rights reserved.