Image Details
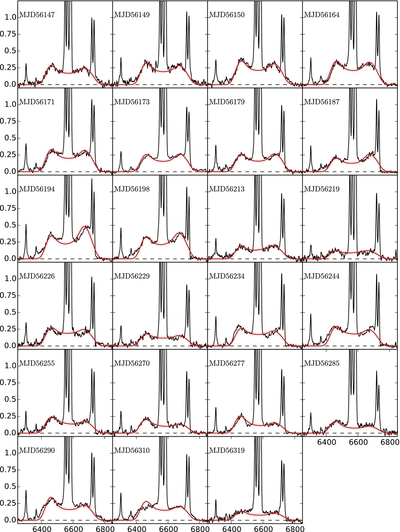
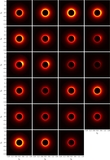
Caption: Figure 2.
Resulting spectra of each epoch after the subtraction of the stellar population contribution and calibration through the fluxes of the narrow emission lines (which do not vary on such short timescales). For each frame the vertical axis is flux in units of 10−15 erg s−1 cm−2 Å−1 while the horizontal axis is wavelength in units of Å. The red solid line is the best fit of the accretion disk model to the data (see Section 4.1 for details).
Other Images in This Article
Copyright and Terms & Conditions
© 2015. The American Astronomical Society. All rights reserved.
Copyright ©
2025 Astronomy Image Explorer. All Rights Reserved.