Image Details
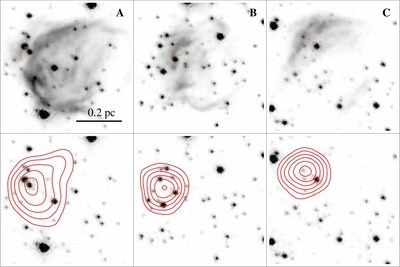
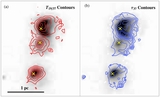
Caption: Figure 8.
Top row: Paschen α (1.87 μm; Wang et al. 2010; Dong et al. 2011) continuum image of regions A, B, and C with the heating source candidate marked in the orange dotted squares. Bottom row: the 1.90 μm image of the same fields as the top row with the same heating source candidates marked overlaid with the 19/37 color temperature contours. Color temperature contours correspond to 110, 115, 120, 125, and 130 K for A, 110, 115, 120, 125, 130, and 135 K for B and 120, 125, 130, 135, 140, and 145 K for C.
Other Images in This Article
Copyright and Terms & Conditions
© 2014. The American Astronomical Society. All rights reserved.
Copyright ©
2025 Astronomy Image Explorer. All Rights Reserved.