Image Details
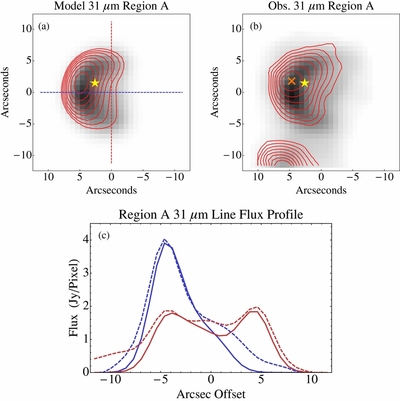
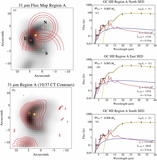
Caption: Figure 7.
(a) 31 μm hemispherical shell emission model of region A overlaid with the position of the heating source and 19/31 model color temperature contours with levels corresponding to 100, 105, 110, 115, 120, 125, 130, and 135 K. (b) The 31 μm observed flux map of region A overlaid with the position of the heating source and the observed 19/31 color temperature peak with contours corresponding to 100, 105, 110, 115, 120, 125, and 130 K. (c) Vertical (red) and horizontal (blue) flux cuts along the lines overlaid in (a) of both the observed (dashed) and model (solid) 31 μm emission.
Other Images in This Article
Copyright and Terms & Conditions
© 2014. The American Astronomical Society. All rights reserved.
Copyright ©
2025 Astronomy Image Explorer. All Rights Reserved.