Image Details
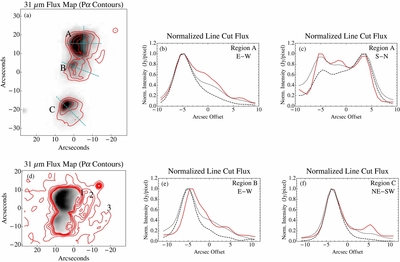
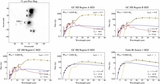
Caption: Figure 3.
(a) Paschen α contours and line cuts overlaid on the 31.5 μm flux map of the Sgr A East H II Complex and normalized line cut flux plots through regions (b and c) A, (e) B, and (f) C of the Paschen α (red solid), 19.7 μm (black dashed), and 31.7 μm (black dotted) emissions. The Paschen α emission has been convolved to match the beam size of the deconvolved 19.7 μm and 31.5 μm maps and the Paschen α contour levels correspond to 0.25, 0.50, 1.0, and 2.0 mJy pixel−1. (d) The 31 μm flux map zoomed in on regions A and B overlaid with Paschen α contours labeled with the locations of "ridges" 1, 2, and 3 with levels corresponding to 0.10, 0.15, 0.20, 0.25, 0.30, 0.35, and 0.40 mJy pixel−1.
Other Images in This Article
Copyright and Terms & Conditions
© 2014. The American Astronomical Society. All rights reserved.