Image Details
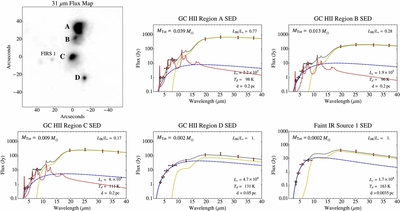
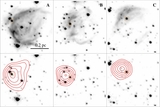
Caption: Figure 5.
31 μm flux map of the Sgr A East H II Complex and DustEM fits (solid gray line) to the dereddened SEDs of regions A–D and the FIRS 1. The DustEM models of regions A–D assume the dust is composed of LGs (aLG: 100–1000 Å), VSGs (aVSG: 6–25 Å), and PAHs (aPAH: 6–10 Å). DustEM models of FIRS 1 assume the same dust composition as the H II region models except the maximum grain size cutoff of the VSGs is 100 Å. The dotted red lines, dot–dashed blue lines, and dashed yellow lines correspond to the PAH, VSG, and LG emission components, respectively. The total dust mass, MTot, and the infrared to total heating source luminosity ratio, LIR/L*, are given at the top of each plot. The heating source luminosity, L* (given in units of L☉), the volume-average dust temperature, Td, and the distance between the heating source and the dust, d, are given at the bottom right of each plot.
Other Images in This Article
Copyright and Terms & Conditions
© 2014. The American Astronomical Society. All rights reserved.