Image Details
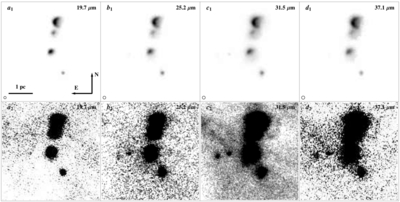
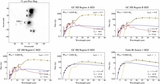
Caption: Figure 2.
Observed (a) 19.7, (b) 25.2, (c) 31.5, and (d) 37.1 μm images of the Sgr A East H II Complex at two different stretches to show bright (top panels) and faint (lower panels) emission. The approximate beam sizes are shown in the lower left corner in each image.
Other Images in This Article
Copyright and Terms & Conditions
© 2014. The American Astronomical Society. All rights reserved.
Copyright ©
2025 Astronomy Image Explorer. All Rights Reserved.