Image Details
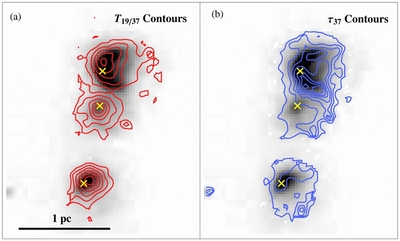
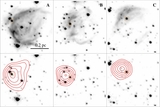
Caption: Figure 4.
31 μm flux map of the Sgr A East H II Complex overlaid with contours of the (a) 19/37 dust temperature and (b) 37 μm optical depth. The location of the 31 μm flux peak in each region is indicated by the yellow cross. The levels of the temperature contours correspond to 90, 100, 110, 120, 130, and 140 K. The levels of the 37 μm optical depth contours correspond to 0.001, 0.0025, 0.004, 0.0055, 0.0075, 0.009, and 0.011.
Other Images in This Article
Copyright and Terms & Conditions
© 2014. The American Astronomical Society. All rights reserved.
Copyright ©
2025 Astronomy Image Explorer. All Rights Reserved.