Image Details
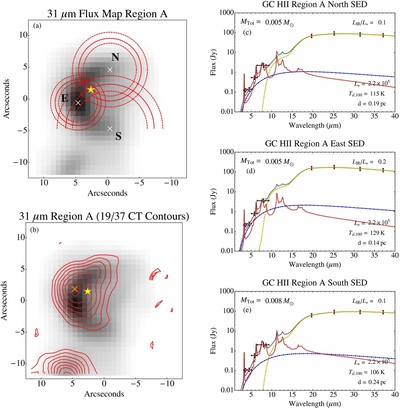
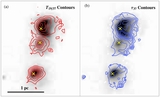
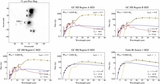
Caption: Figure 6.
(a) 31 μm flux map of region A overlaid with annuli representing the possible locations of the heating source centered on the north, east, and south positions, which are marked by white crosses. The outer and inner dashed rings represent the 1σ (~20%) uncertainty in the inferred heating source luminosity. The star indicates the implied location of the heating source, the intersection of the three annuli. (b) The 31 μm flux map of region A (grayscale) overlaid with the location of the peak 19/37 color temperature, which is shown as the orange cross, and contours corresponding to 100, 105, 110, 115, 120, 125, and 130 K. (c)–(e) DustEM model fits (solid gray line) to SEDs at the north, east, and south positions of region A. Td, 100 is the temperature of the 100 Å sized grains determined by the DustEM models. L*, the heating source luminosity, is given in units of L☉. The dotted red lines, dot–dashed blue lines, and dashed yellow lines correspond to the PAH, VSG, and LG emission components, respectively.
Other Images in This Article
Copyright and Terms & Conditions
© 2014. The American Astronomical Society. All rights reserved.