Image Details
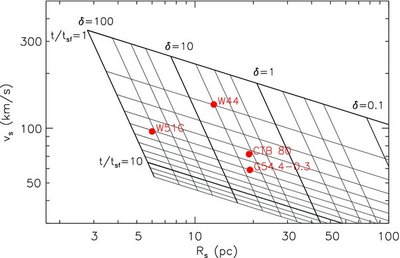
Caption: Figure 9.
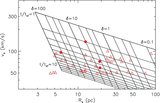
Radius–velocity relation of H i SNRs. The grid is for E 51 = 1. The grid shifts along lines of constant δ for different E 51 but not much: e.g., for E 51 = 0.1, the lines of constant t/ t sf shift down by 36%. The thin grid lines in δ are drawn at 20, 30, and 50% of the thick-grid intervals, while those in t/ t sf are at every 10%. The four H i SNRs identified in the I-GALFA survey are marked.
Other Images in This Article
Copyright and Terms & Conditions
© 2013. The American Astronomical Society. All rights reserved.
Copyright ©
2025 Astronomy Image Explorer. All Rights Reserved.