Image Details
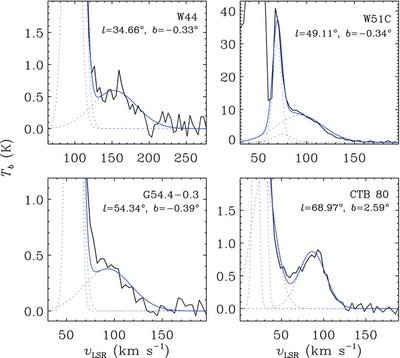
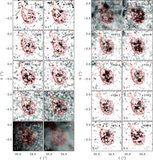
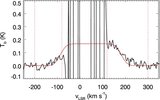
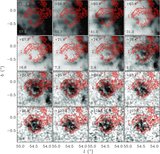
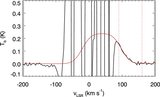
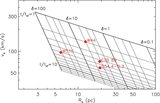
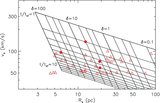
Caption: Figure 6.
H i 21 cm spectra of some prominent HV clumps in individual SNRs (black lines). Their positions are given in the upper right corner of each panel. The HV parts of the spectra have been fitted by several Gaussian components, and the blue dotted and solid lines show the profiles of individual components and their sum, respectively. The components at the highest velocities are the ones related to the fast-expanding H i shells.
Other Images in This Article
Copyright and Terms & Conditions
© 2013. The American Astronomical Society. All rights reserved.
Copyright ©
2025 Astronomy Image Explorer. All Rights Reserved.