Image Details
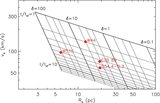
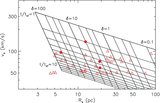
Caption: Figure 10.
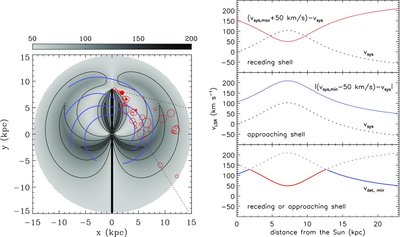
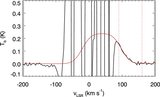
Left: distribution of v det, min, the minimum expansion velocity of a fast-expanding SNR H i shell for detection. Areas with higher minimum expansion velocities are darker. The scale bar at the top displays velocity scales in a unit of km s −1. Contour levels are drawn at 70, 100, and 130 km s −1. The Sun is located at x = 0.0, y = 8.5 kpc. The dotted lines mark the boundaries of the I-GALFA survey at b = 0°, i.e., ℓ = 32° to 77°. The blue curved lines represent the four spiral arms of Taylor & Cordes (1993). The locations of the SNRs in the I-GALFA area are marked by red circles with diameters proportional to SNR size. The SNRs with fast-expanding H i shells are marked by the filled circles. Right: one-dimensional velocity profiles at ℓ = 32°. Minimum expansion velocities required for the detection of receding (top frame) and approaching (middle frame) portions of the shell are shown together with the systemic LSR velocity ( v sys) as a function of distance from the Sun. v det, min is the smaller of the two velocities (bottom frame). (See text for details.)
Other Images in This Article
Copyright and Terms & Conditions
© 2013. The American Astronomical Society. All rights reserved.