Image Details
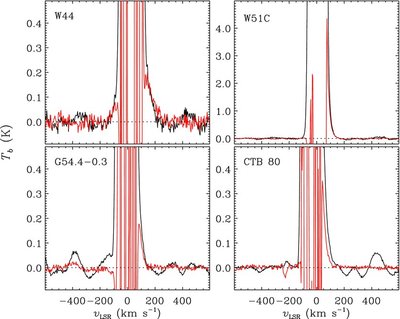
Caption: Figure 1.
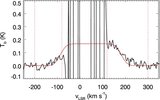
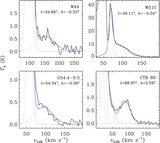
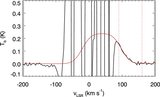
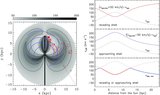
Average H i 21 cm line profiles of SNRs that have associated high-velocity H i emission. Average profiles toward the SNRs are in black, while background-subtracted profiles are in red. (See Section 2 for details of the background subtraction.) Variations in H i 21 cm brightnesses between the source and background directions cause the wild fluctuations in the background-subtracted profiles at low velocities (| v LSR| ≲ 100 km s −1), but these have no effect on our analysis.
Other Images in This Article
Copyright and Terms & Conditions
© 2013. The American Astronomical Society. All rights reserved.
Copyright ©
2025 Astronomy Image Explorer. All Rights Reserved.