Image Details
Caption: Figure 7.
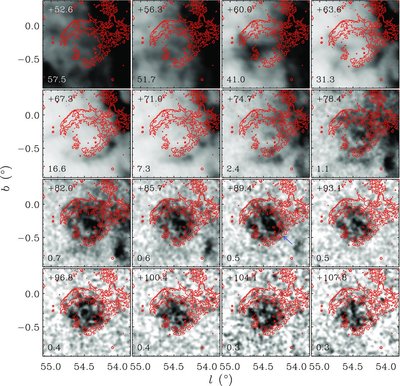
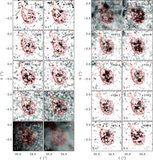
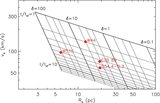
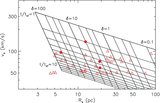
Channel maps of HV H i gas associated with the SNR G54.4–0.3 in the I-GALFA H i data. As in Figure 4, the central LSR velocity of each panel is shown in the upper left corner in km s −1, and the velocity width of one channel is 3.68 km s −1. The H i brightness temperature in each gray scale ranges from 0 K (white) to the value (black) at the lower left corner of each panel in kelvins. Radio continuum morphology of the SNR is shown by red contours as in Figure 3. The blue arrow in the +89.4 km s −1 panel marks an emission feature described in Section 3.2.2.
Other Images in This Article
Copyright and Terms & Conditions
© 2013. The American Astronomical Society. All rights reserved.
Copyright ©
2025 Astronomy Image Explorer. All Rights Reserved.