Image Details
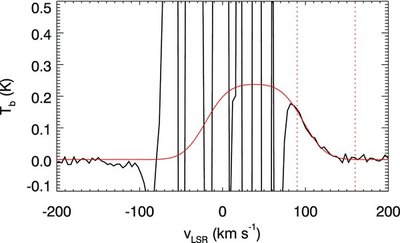
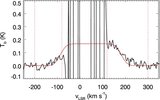
Caption: Figure 8.
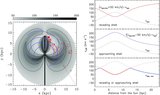
Fit to the average H i profile of G54.4–0.3. Low-velocity residual brightness fluctuations are as in Figure 1. The red solid line is a best fit to the profile. The red dotted lines mark the velocity range where the fit has been performed. See Section 3.1.2 for an explanation of the fit.
Other Images in This Article
Copyright and Terms & Conditions
© 2013. The American Astronomical Society. All rights reserved.
Copyright ©
2025 Astronomy Image Explorer. All Rights Reserved.